

Has it ever happened to you that you explain very abstract concepts in class, only for the students not to quite understand them? A useful mechanism for dealing with abstraction in a computer programming class is the use of physical models in resin, similar to the toys we learned with as children. 3D printing enables the creation of physical scale models that represent abstract theoretical concepts, helping students connect theory with practice in a tangible, interactive way. In education, this technology has been successfully incorporated into teaching several areas of knowledge; however, in computing, I have not found similar integration. In this article, I share how to integrate 3D printing to create tangible teaching materials that computer science students can use to improve their understanding of complex concepts and improve their programming skills.
Nowadays, it is possible to find universities that have integrated 3D printing into pedagogical practices across different areas of knowledge. For example, in engineering, the printing of molecules is used to explain chemical concepts (Trujillo-Cayado et al., 2024). In medicine, physical models of cadavers are printed to teach anatomy (Lim et al., 2015) and the structure of the human body, such as the heart muscle (Salewski et al., 2022). Similarly, in veterinary medicine, printed large-scale models of feline skeletons are used (Fidanci & Orhan, 2025). In robotics education, student-designed robot parts are printed (Kefalis et al., 2024), while in biomedical education, components for muscle rehabilitation are printed (Munir et al., 2025). However, I have not identified a comparable evolution of this technology in teaching computer science. In this area, we have relied heavily on animations, digital simulations, and coding. Therefore, let’s explore the use of 3D printing in the computing field.
Dr. Hideo Kodama originated 3D printing, also known as layered resin printing with ultraviolet light, in 1981. Five years later, Chuck Hull filed his own patent for stereolithography (SLA) and commercialized the technology. Today, forty years later, this industry is estimated to be valued at approximately 40 billion dollars by 2030 (the market for printers in factories and homes) (Ultimaker, 2025). The general push to utilize 3D printers has gained strength in classrooms over the last decade, opening new avenues of use and transforming teaching (Andic, 2024). The relevance and number of 3D printing applications are so significant that 3D printer design companies, such as Dassault Systèmes and Formlabs, formally recognize the educational market for 3D printers. The technological advancements in printers have enabled miniaturization and mass production, lowering printing costs to the point where custom 3D models can feasibly be generated for a classroom.
After almost half a century, teaching data structures still relies on traditional techniques
Since the seventies, the teaching of data structures has been included in information or computer science curricula. Although topical since the 1960s, its popularity grew as a core topic in computing after the publication of Niklaus Wirth’s book Algorithms + Data Structures = Programs in 1976. For the next few decades, textbooks and coding were the norm in data structure teaching.
Later, with access to personal computers, the norm evolved because students could practically implement different data structures in a programming language from diagrams and definitions. It is important to emphasize that definitions, diagrams, and code are highly complex and abstract.
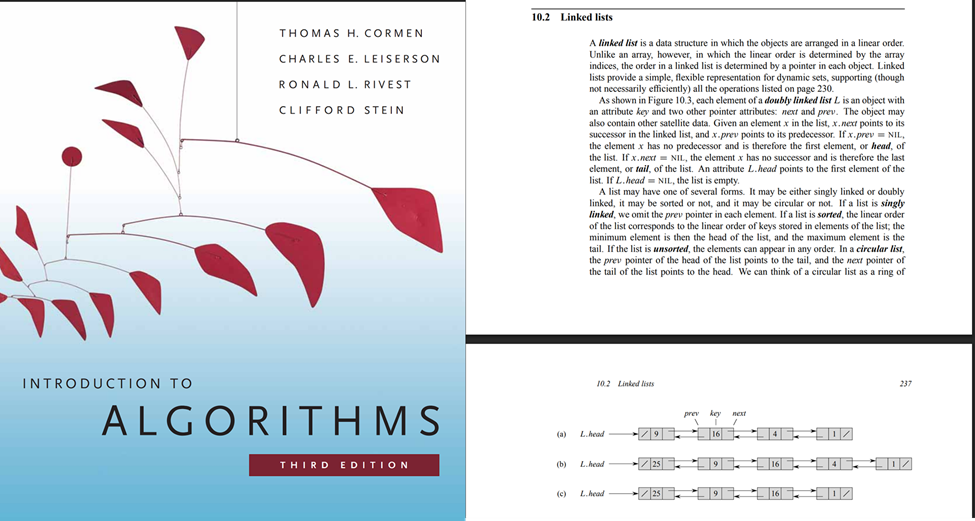
Below is an example taken from the most famous and popular textbook in the area of computing from its first edition in 1990 to its fourth edition in 2022. The image is from the third edition (Cormen, 2009).
Fortunately, since 1981, small efforts to produce videos of algorithmic visualizations have begun, and every year since, due to advances in graphical interfaces in Java and the internet boom with JavaScript, increasingly complete visualizations have been generated. By 2010, it was already common to accompany textbook definitions with animations or simulations. Since then, simulations have been used to exemplify processes or algorithms better and to simplify the transition from algorithms to programming code as much as possible. However, because these concepts are multidimensional and abstract, it is common to lose more than one learner during the transition from algorithm to coding, which can generate frustration among both students and teachers. Therefore, it is imperative to continue exploring new ways to rethink, expand, and deepen our pedagogical approaches.
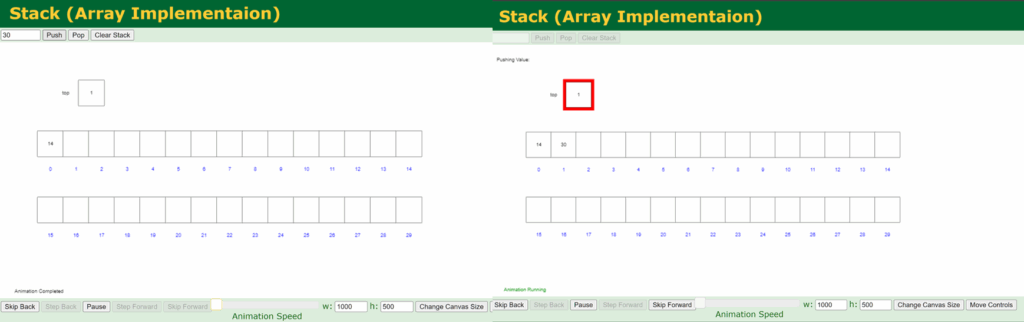
Here are two very popular, free online simulators you can use in your programming class. The first, the Data Structure Visualizations simulator, by David Galles of the University of San Francisco, has been in force since 2011. Figure 2 shows the simulation of a stack.
The second simulator, VisuAlgo, is from the National University of Singapore. Figure 3 shows a linked list and the code for inserting an item.

Although simulators have helped improve the teaching of programming, the process has at least two layers of complexity or abstraction. The first layer is the algorithm, depicted visually in diagrams or in natural language, and the second layer is the code, which translates the algorithm into an abstract language that the computer can understand. Both layers are abstractions: one in a logical system (i.e., the idea) and the other in a programming language that implements the idea.
The problem with simulations is that students sometimes understand the concept but struggle to implement it in code. Simulations help explain processes, but they often struggle to connect well with coding. Many of the more sophisticated simulations show the code to be on par with the simulation, but sometimes they result in brutal cognitive saturation.
The degree of abstraction is even higher in more complex data structures
The problem is accentuated in areas of greater abstraction, such as data structures and object-oriented programming, where both code and simulation are abstract. To give an extreme example, the explanations end up being of the type:
“The first generic thing (datum) is connected with the second generic thing (datum) by means of the abstract relation to the generic thing of the same type (pointer).”
The explanation is correct, but even with ball-and-line animations, it becomes hard to digest. Additionally, the transition from algorithm to code can be time-consuming and frustrating.
To clarify, I add an example of the simplest data structure, the “chained list.” Here’s what the conceptual definition looks like in a visualization:
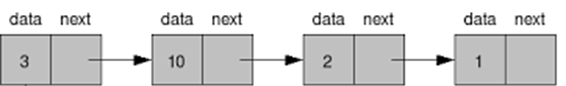
This is what a node or cube looks like in code:
struct Node {
int data;
struct Node* next;
}
Although there are some technical reports from universities published in forums such as the ACM and in open access repositories such as https://openportal.isti.cnr.it, no formal works have been identified in the academic literature that focus specifically on data structure, which is a central part of the curriculum of any academic computer science program, and one of the primary topics of technical interview questions to get a job.
3D printing for teaching computational data structures
For my programming class, I designed and printed resin parts representing data structures to explain how the assembly process works between them and to better identify where the process begins and ends. The objective was to simplify the transition from simulation/visualization to programming code.
For the initial tests, I selected introductory topics in data structures, including linked lists, stacks, and queues. These three structures share multiple elements because stacks and queues are subtypes of lists; therefore, the designed pieces can be interchanged.
The resin impressions were generic pieces that could be assembled modularly to represent the data and the pointer. A pointer is an implementation statement used to connect to other data. At this point, we have an intermediate representation between the algorithm and the code, but with a tangible, physical model. In this way, we can assemble the data writes as if they were LEGO pieces, but with pieces that better represent the implementation using pointers. The impressions were made using the Mostla equipment on the Querétaro campus. Mostla is a department that lends equipment for academic projects.
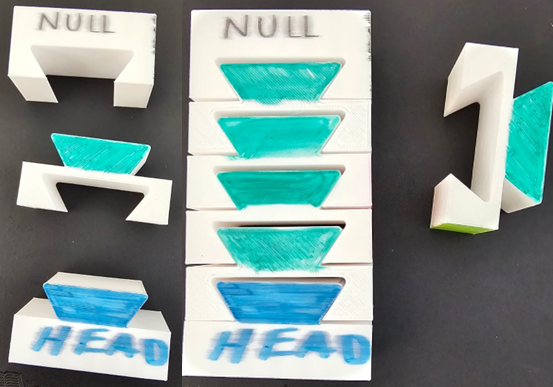
In total, we printed seven pieces, each representing an object with its data and a pointer: an initial piece representing the head or top of the structure, and a final piece representing the end of the structure or a null object.
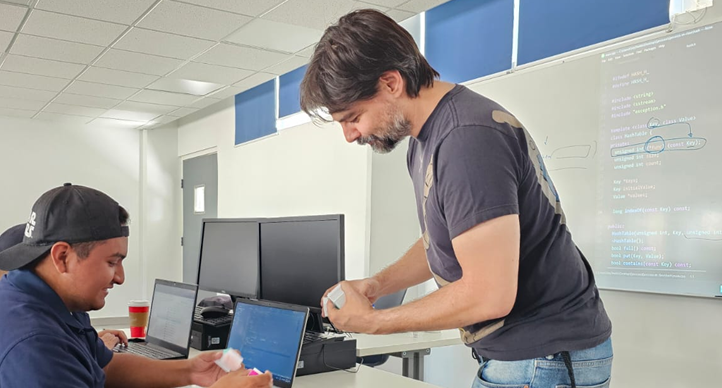
The class dynamics unfolded in several stages: first, the theory was explained on the blackboard; then, a visual simulation was created; later, the 3D models were introduced and distributed to the students. The students interacted with the 3D pieces in a practical, exploratory manner; that is, they specified the visual representations and physical objects and assembled the structural pieces to better understand the relationship between data and pointers. Finally, the students implemented the structures in computer programs.
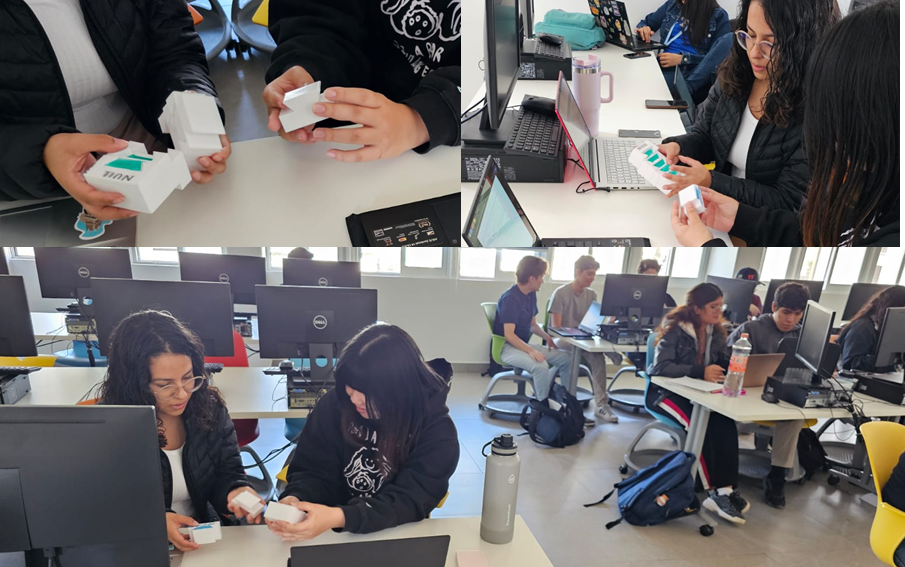
The students experimented in class with parts printed in resin to gain a better understanding of data structures. However, I would like to have more pieces so that all students can engage with them simultaneously.
Physical 3D printing models do help improve explanations of concepts
The 3D models were tested with a data structures class of 20 third-semester programming students in 2024 and another class of 18 students in 2025. The interventions and measurements were designed to minimize changes to the class dynamics, except for the additional 10-minute explanation using the 3D models. The topics were presented over three weeks, one topic per week, and a survey was applied at the end of the course. The Likert-scale survey was designed to measure students’ perceptions of the topic. The questions aimed to determine students’ preferences for the explanation format and whether they found the additional use of 3D-printed physical structures functional in the learning process. Thirty-one of the 38 students answered the survey.
All students reported a preference for explanations in mixed and complementary formats, as expected. When asked to select the formats of their choice (they could choose several), most opted for coding first, then physical models, then simulations, use of blackboards, and finally theoretical verbal explanations. It should be noted that simulations, blackboards, and physical models were almost tied at 80% in terms of preference.
Also, we asked for each structure individually: lists, queues, and stacks, if they found it helpful to have a 3D model to understand the subject better. The acceptance percentages for using 3D models for each structure were: lists, 96.8%; queues, 90%; and stacks, 90%. In general, they answered positively at a rate above 90%. And when asked which other structures they wanted physical models of, they mostly responded with trees first, then graphs, and, in a tie, hashes and ordering algorithms.
In general, the surveys confirmed what we see in the data structures literature, that physical models do help to improve explanations, but they should not be used as substitutes. It is essential to understand that improvement comes more from the motivational side of the student; that is, they feel it helps them more, and therefore, they are more receptive and improve their learning experience. However, more studies are needed to determine whether using physical models improves their grades.
Additionally, we confirmed that in the area of computing, simulations, and coding are the preferred formats and those students are most accustomed to. Additionally, purist explanations in a single format are insufficient; mixed approaches are necessary.
Reflection
In retrospect, I believe that small actions like these help in various ways to improve the student and teacher experience. They improve the classroom environment because students perceive a palpable effort to provide them with the best possible teaching resources, which helps maintain a healthy environment where explanations flow more easily. Additionally, it enables them to consider an abstract subject from a different perspective. From personal experience, I think that the simple act of designing the physical models deepened my understanding of the subject.
Three areas to improve are: 1) Conduct a more sophisticated study to measure the direct impact on learning beyond students’ perceptions. 2) Print parts that are suitable for more complex structures. (We are currently working on printing nodes for graphs.) 3) It would also be helpful to print more pieces so that all students can use them simultaneously and not have to wait or borrow.
If you have a 3D printer available, whether at your university or at home, there are a variety of free resources to help you get started. You can design your own materials or look for a repository that has pieces similar to what you seek. It is enough to have an idea of a topic to make the test; it is not necessary (nor is it the objective) to print models of the entire syllabus. If you have any questions or suggestions, please contact me at bvaldesa@tec.mx
About the Author
Benjamín Valdés Aguirre (bvaldesa@tec.mx) has a Ph.D. in Computer Science with a specialty in Artificial Intelligence. He is a computer science professor at the Querétaro campus of Tecnologico de Monterrey and has 12 years of experience developing computer and artificial intelligence courses.
References
Adeyemi, A. A., Jarad, F. D., Komarov, G. N., Pender, N., & Higham, S. M. (2008). Assessing Caries Removal by Undergraduate Dental Students Using Quantitative Light‐Induced Fluorescence. Journal of Dental Education, 72(11), 1318–1323. Wiley. https://doi.org/10.1002/j.0022-0337.2008.72.11.tb04614.x
Anđić, B., Maričić, M., Weinhandl, R. et al. (2024). Metaphorical evolution: A longitudinal study of secondary school teachers’ concepts of 3D modelling and printing in education. Educ Inf Technol 29, 14091–14126 https://doi.org/10.1007/s10639-023-12408-x
Cormen, T. H., Leiserson, C. E., Rivest, R. L., & Stein, C. (2009). Introduction to algorithms (3rd ed.). The MIT Press
Fidanci G. S., Orhan I. (2025). The Role of 3D Laser Scanning and Printing in Veterinary Anatomy Education: A Study on Feline Scapula and Humerus. Indian Journal of Animal Research. 59(9): 1593-1598. doi: 10.18805/IJAR.BF-1986.
Kefalis, C., Skordoulis, C., Drigas, A.(2024). The Role of 3D Printing in Science, Technology, Engineering, and Mathematics (S.T.E.M.) Education in General and Special Schools. International Journal of Online and Biomedical Engineering (iJOE), 20(12), pp.4–18.
Lim, K. H. A., Loo, Z. Y., Goldie, S. J., Adams, J. W., & McMenamin, P. G. (2015). Use of 3D printed models in medical education: A randomized control trial comparing 3D prints versus cadaveric materials for learning external cardiac anatomy. Anatomical Sciences Education, 9(3), 213–221. Wiley. https://doi.org/10.1002/ase.1573
McMenamin, P. G., Quayle, M. R., McHenry, C. R., & Adams, J. W. (2014). The production of anatomical teaching resources using three‐dimensional (3D) printing technology. Anatomical Sciences Education, 7(6), 479–486. Wiley. https://doi.org/10.1002/ase.1475
Munir, M. T., Jamwal, P. K., Li, B., Carter, S., & Hussain, S. (2025). Revolutionising engineering pedagogy: The role of 3D printing in modern engineering education. Innovations in Education and Teaching International, 62(2), 575-593.
Salewski, C., Nemeth, A., Sandoval Boburg, R., Berger, R., Hamdoun, H., Frenz, H., Spintzyk, S., Hahn, J. K., Schlensak, C., & Krüger, T. (2022). The impact of 3D printed models on spatial orientation in echocardiography teaching. BMC Medical Education, 22(1). Springer Science and Business Media LLC. https://doi.org/10.1186/s12909-022-03242-9
Trujillo‐Cayado, L. A., Santos, J., Cordobés, F., & Ramos‐Payán, M. (2024). Influence of the use of 3D printing technology for teaching chemistry in STEM disciplines. Computer Applications in Engineering Education, 32(4). Wiley. https://doi.org/10.1002/cae.22738
Ultimaker. (n.d.). The complete history of 3D printing. Ultimaker. Retrieved November 17, 2025, from https://ultimaker.com/learn/the-complete-history-of-3D-printing/
Editing
Edited by Rubí Román (rubi.roman@tec.mx) – Editor of the Edu bits articles and producer of The Observatory webinars- “Learning that inspires” – Observatory of the Institute for the Future of Education at Tec de Monterrey.
Translation
Daniel Wetta