


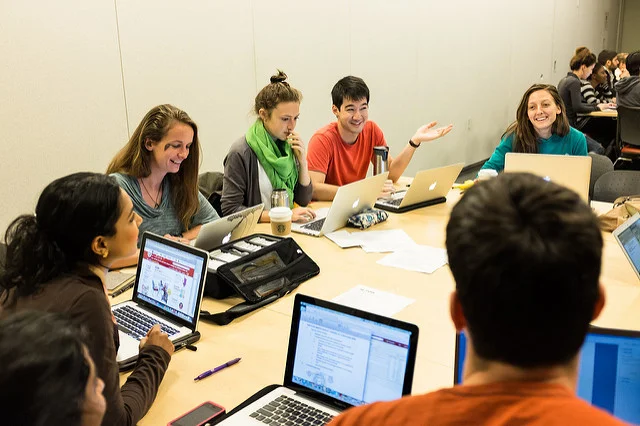
University students think that the use of infographics would enhance transmission of educational content in presentations, tasks, exams and manuals, according to a study.
Photo: Bigstock
Infographics are visual tools to transmit knowledge; their use aims to simplify complex information and to synthesize large amounts of data. These types of resources are present in magazines, social media, newspapers, and advertising, however, they are little used as a teaching tool.
An academic from the University of Osijek, Croatia, surveyed 100 university students to explore their point of view on the use of infographics in educational content. The results suggest greater use of these visual representations by teachers and students.
Study key points
- The students answered that the process of transmitting educational content would be more efficient if the teachers used more infographics in presentations (85%) when creating manuals (39%), in tasks (30%) and exams (25 %).
- The survey revealed that students think their activities are more attractive and efficient if they use infographics when making presentations (75%), creating posters (52%), promoting events or seminars (47%) and when doing work for evaluation (31 %).
- The respondents revealed that the infographics show better quantitative (90%), scientific (86%) and historical (85%) data.
- 84% of the evaluated affirmed that the training of both students and teachers regarding the use of infographic materials would be positive.
- The platforms most used by university students to generate this type of images are Canva (34%), Adobe Spark (20%), Piktochart (14%), Infogram (4%) and Adobe Illustrator (3%).
Another research cited by the author affirms that infographics are a useful tool when communicating science topics to inexperienced students. Likewise, these visual resources make the educational material something memorable and easier to understand.
If you are a teacher, we recommend you the use infographics to enrich and diversify your lessons. You can start by exploring these free platforms: Canva, Adobe Spark, Piktochart or Venngage.


Rubí Román
Rubí Román
Rubí Román