
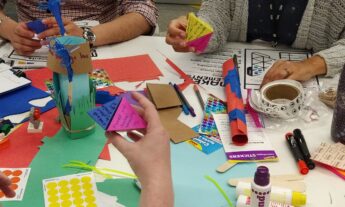
In order for students to develop the expected competencies throughout their career, it is essential to provide them with adequate spaces and tools.
As a professor and the director of the Industrial and Systems Engineering (IIS) degree program, I had the opportunity to view and analyze more than 30 presentations of the capstone projects completed by students for different companies. These projects represent the pinnacle of their studies, allowing them to validate and apply their disciplinary and transversal competencies to real contexts and problems. One of my biggest surprises was discovering that: More than 90% of the IIS capstone projects only reach the solution design stage, without continuing to the testing or implementation phases.
This evidence led us to the conclusion that a capstone project is not the most suitable space to develop the competency of “solving organizational problems using Industrial Engineering tools”.
data-animation-override>
“More than 90% of the Industrial and Systems Engineering (IIS) degree program, capstone projects only reach the solution design stage, without continuing to the testing or implementation phases.”
The main causes of its limited scope are:
- Difficulty in obtaining information. 50% of the time invested in projects is spent on defining the problem and obtaining quantitative data for comparison purposes and to generate possible solutions.
- Data use difficulties. 40% of the projects fail to provide a quantitative analysis as the basis of the proposed solution, using quantitative methods related to Industrial Engineering, such as Statistical Quality Control, Six Sigma and Lean Manufacturing.
During the remaining phases of the problem-solving cycle (testing, implementation, operation and measurement), there are several systemic aspects that are difficult to quantify:
- Attitude and commitment of employees.
- Reliability of equipment and machinery.
- Communication methods and data.
- Human beings’ innate resistance to change.
Not having this experience makes it difficult for students to gain a full vision of their capacity to solve real problems.
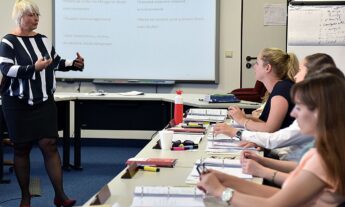
So, how can we make sure that our students develop competencies if they do not have the spaces or the tools to do so? Companies require industrial engineers who:
- Have had extensive experience in problem solving, where they have tested their proposed solutions, revised their mistakes or understood the impact of unquantifiable variables, such as the commitment or attitude of the people involved.
- Use “hard” data to perform quantitative analyses to find the causes of problems, design alternatives for improvement and measure the final performance results.
To mitigate these problems, we developed a web application that models real productive processes virtually and in real time in order to know them, improve a performance criterion or measure the level of performance of an already improved process. The application is called TableroTec (tablerotec.com) and is currently available only to Tec faculty and students.
If you do not have access, this video will demonstrate how it works:
data-animation-override>
“How can we ensure that our students develop certain competencies if they do not provide the spaces or the tools to do so?”
The “TableroTec” app makes it possible to:
- Model processes with a highly flexible configuration to represent any type of process (continuous, intermittent, mixed) and number of work stations (from one on).
- Collect complete and timely information on a process, using mobile devices (cell phones or tablets) as sensors that will indicate the start and end of work cycles.
- Visualize in real time and on a screen the flows of process information/material and the lead, cycle and wait time parameters.
- Store information immediately and reliably for future consultations and analyses.
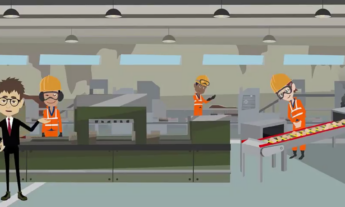
With the “TableroTec” app, users can model any type of process, number of operations and location, from basic online processes with 2 or 3 stations implemented in a classroom, to complex intermittent-flow processes with more than 10 automated stations operating in an automotive plant. With this system, data are collected quickly, completely and with few resources (access to the internet and mobile devices), in such a way that the project time is spent mainly on the solution design, tests and measurement for validation purposes.
data-animation-override>
“Companies require industrial engineers who have experience in solving problems and know how to develop a quantitative analysis to find the causes of these problems and propose alternatives for improvement.”
The operating process is very simple: the teacher or main user configures the app to generate a diagram with the stations, define the product and establish the data-collection parameters (collection time, product type, selected configuration). The app generates a space where students connect through a code on their smartphones or tablets, thus generating an information network between mobile devices (the work stations) and the server (the app). By indicating the beginning and the end of each cycle on each device, the app collects the information and generates the data flows and process parameters in a dynamic, real manner.
The following risks in terms of the app’s functionality have been identified and must be taken into consideration:
- Need for training. Although the app is user friendly and offer video tutorial, students require a training session to be able to use the app correctly.
- Internet use. A reliable internet network is required to enable communication between the mobile devices and the server.
- Resistance to change. An interesting effect observed is that some students reject the idea of showing their improvements with quantitative data. They are not used to presenting the effects of their implementation since the majority of projects only reach the proposal design phase.
Right now, the app has basic capacities, but with greater use it could be enriched with other functionality levels, such as capacity calculation or key performance indicators, such as OEE (Overall Equipment Efficiency), to name a few.
About the author
Miguel Rocha Romero is the Director of the Master of Science in Quality Systems and Productivity at Tecnológico de Monterrey, Campus Querétaro. He holds a doctorate from the University of Alberta and specializes in improvement processes, such as Lean Manufacturing, Six Sigma, ISO 9001, IATF 16949 and the National Quality Prize.


This article from Observatory of the Institute for the Future of Education may be shared under the terms of the license CC BY-NC-SA 4.0 


Gerardo Castañeda Garza
Gerardo Castañeda Garza
Gerardo Castañeda Garza